Lifetime & Other Parameters Panel
Introduction
This panel contains the Lifetime & Other Parameters graph which receives plots
from several Analysis main menu functions, Phasor Graph right-click menu
functions as well as plots sent by Decay Fit Parameters Map right-click menu
functions. The plots therefore may have different meaning and sizes.
To account for this diversity, the graph has two vertical axes. The left axis
(Lifetime (ns)) corresponds to lifetime (or in general time) values, while
the right axis (Other Parameters) is typically used to plot NLSF parameters.
The horizontal axis might take on a different name depending on context (for
instance Time (s) for a time series analysis, or Intensity when plotting
a Lifetime vs Intensity plot). Axes labels can be edited in the Scale Legend
box (between the Graph Palette and Cursor Legend in the figure below) and
have only a visual aid function.
Each plot can be associated to either one of the two vertical axes by
right-clicking on the plot icon in the graph legend and navigating down to the
Y Scale menu:
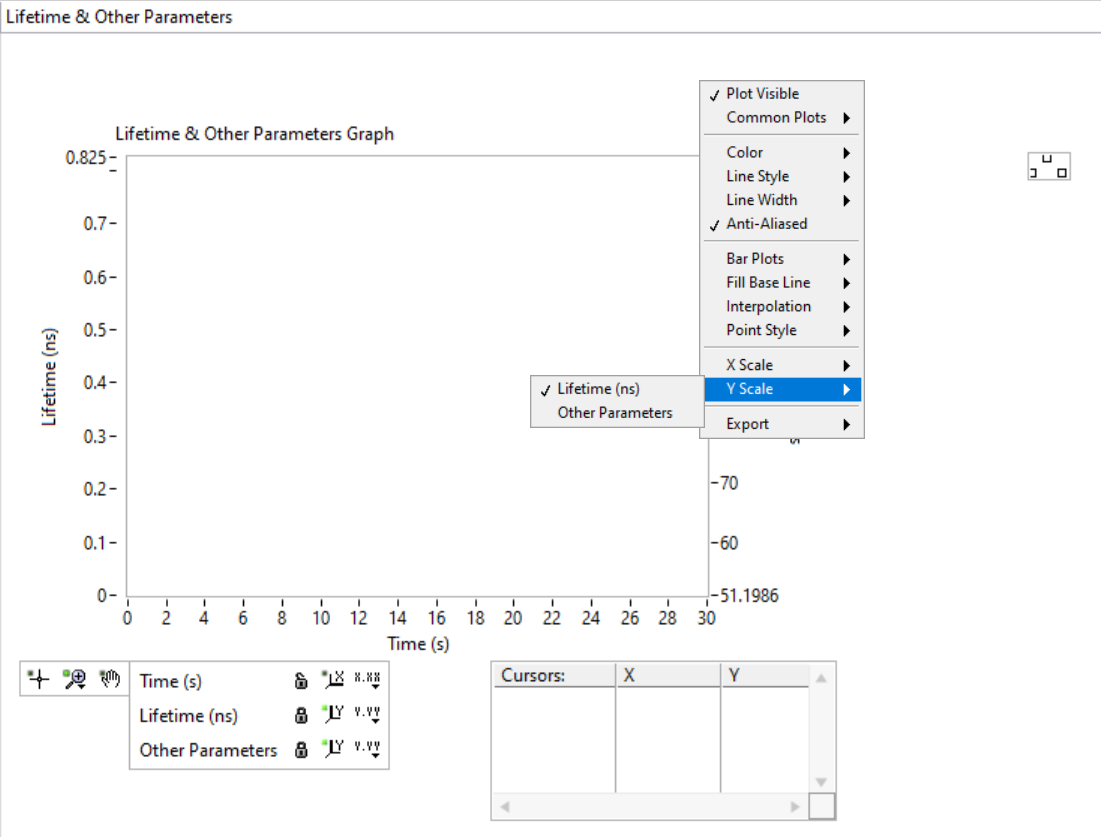
and selecting the relevant axis. Plots that “don’t look right” might just be associated with the wrong Y axis.
The following is a list of possible plots that will be sent to this panel.
Average lifetime
As discussed in the Phasor Ratio panel manual page, computation of a phasor ratio is generally accompanied by the calculation of the corresponding average lifetime, based on the formulas in the introduction to phasor ratio references in the Phasor Graph panel manual page.
Decay fit parameters
As discussed in the Fluorescence Decay Fitting manual page, it is possible to have the different parameters of a series of fits output sent as separate plots (one plot per selected parameter). These plots are sent to the Lifetime & Other Parameters graph.
Decay shifts +———–
When decays are aligned with respect to a Reference Decay as part of a decay
preprocessing step, the corresponding computed temporal shifts are stored in
memory. The corresponding series of shifts can be represented as a plot using
the Plot Decay Shifts right-click menu item of the Lifetime * Other
Parameters graph.
Lifetime & Other Parameters graph context menu
The Lifetime & Other Parameters graph has some specific context menu items described next:
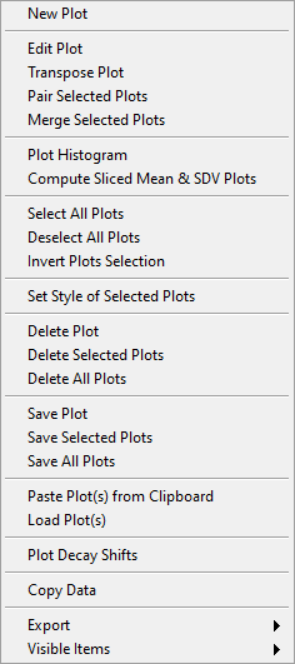
Transpose Plot: thePlot Histogrammenu item described later only works on the vertical coordinate. In order to histogram the horizontal coordinate of a scatterplot, it is therefore necessary to transpose that plot using this function.Pair Selected Plot: when two plots have the same abscissa array, they can be written \({(x_i, y_i)}_{i = 1,..,n}\) and \({(x_i, g_i)}_{i = 1,..,n}\). Pairing these two plots consists in building the following plot: \({(y_i, g_i)}_{i = 1,..,n}\).Merge Selected Plots: appends several plots to one another to form a larger plot containing all their data.Plot Histogram: builds an histogram (with user-provided bin size) of the selected plot. This opens the Histogram window (described in the corresponding page of the manual, where a number of further analyses can be carried out.Compute Sliced Mean & SDV Plots: this function allows computing the mean and standard deviation (SDV) of a plot by “slice”. Slices correspond to subsets of the plot’s data defined by fixed ranges of the abscissa values. The function requires input from the user, provided in the Sliced Mean & SDV Options window:
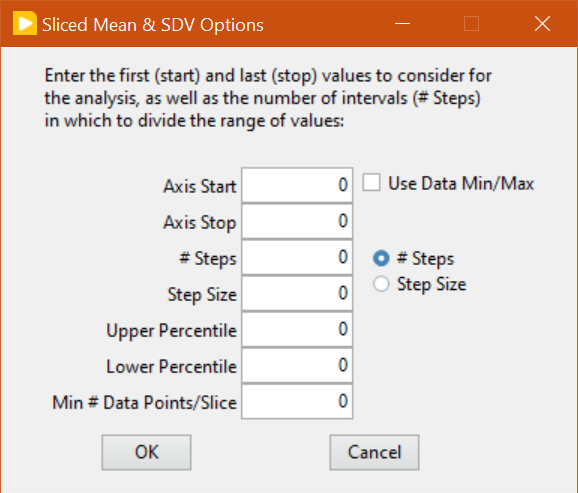
The slices are defined by:
the first and last values of the abscissa considered (
Axis StartandAxis Stop), which can be manually entered or automatically set to the data minimum and maximum values if theUse Data Min/Maxcheckbox is checked off.the number of slices or their “width” (
# StepsorStep Size) depending on the radio button selection.within the data in each slice, the data
LowerandUpper Percentileretained in the analysis (allowing to reject outliers).the minimum number of data points in a slice to compute the mean and SDV.