Image Histogram Panel
Time-gated images can contain very different numbers of counts per pixel and therefore it may be desirable to adjust their contrast either automatically or manually. Moreover, inspection of the image histogram allows defining background thresholds in order to remove background contamination from phasor plots, as discussed below.
Note that this type of processing is not necessarily useful during series analysis and can slow it down somewhat. Therefore, it is possible to skip this step (of histogram calculation) as well as the associated image contrast adjustment step by unchecking the Active checkbox at the top left corner of the panel.
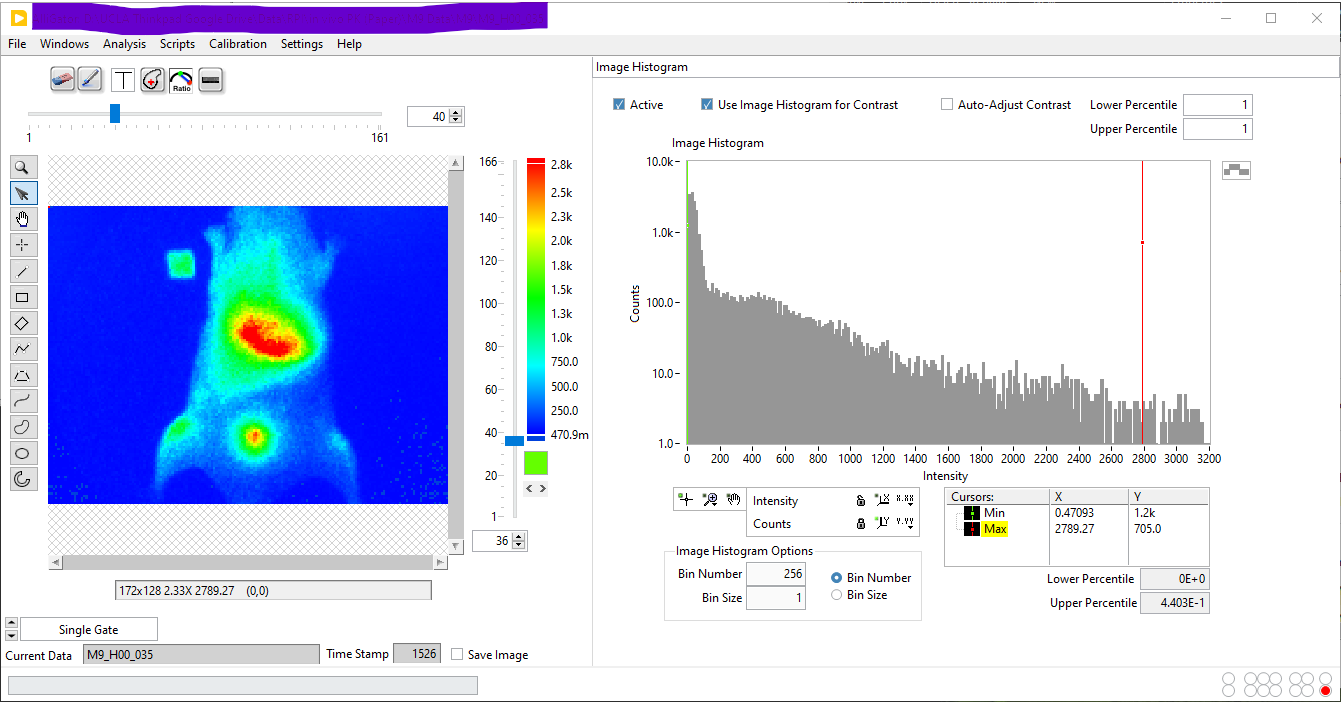
The Image Histogram panel represents the pixel values of the selected image
in the pull-down Displayed Image control at the bottom left of the image, as
a n-bin Image Histogram, where n is the value of the Bin Number
control located below the histogram and the Bin Number radio button next to
it is pressed:
If the Bin Size radio button is pressed instead, the value in the Bin Size control to the left is used, resulting in a number of bins n that will vary depending on the image pixel values range.
It is generally preferable to use a fixed Bin Size value (e.g. 1) so that the histograms of different images with the same number of pixels can be easily compared. On the other hand, if the resulting number of bins is excessively large, the histogram might be sparse and of little use. Additionally, it is worth keeping in mind that histograms with more than \(10^5\) bins are not computed to avoid running out of memory or slowing down image analysis.
Histogram Min & Max Cursors
Two cursors (Min and Max), defined in the bottom rightcorner of the histogram, can be used to define the image display range. They will be taken into account only if the Use Image Histogram for Contrast checkbox above the histogram is checked.
Any pixel in the original image with value smaller than Min (resp. larger than Max) will be represented with the color corresponding to the lowest (resp. highest) color, which can be selected individually at the bottom and top of the selected palette. The example illustrated above uses lowest and highest colors that are identical to the min and max value of the color palette, therefore no specific effect is obtained.
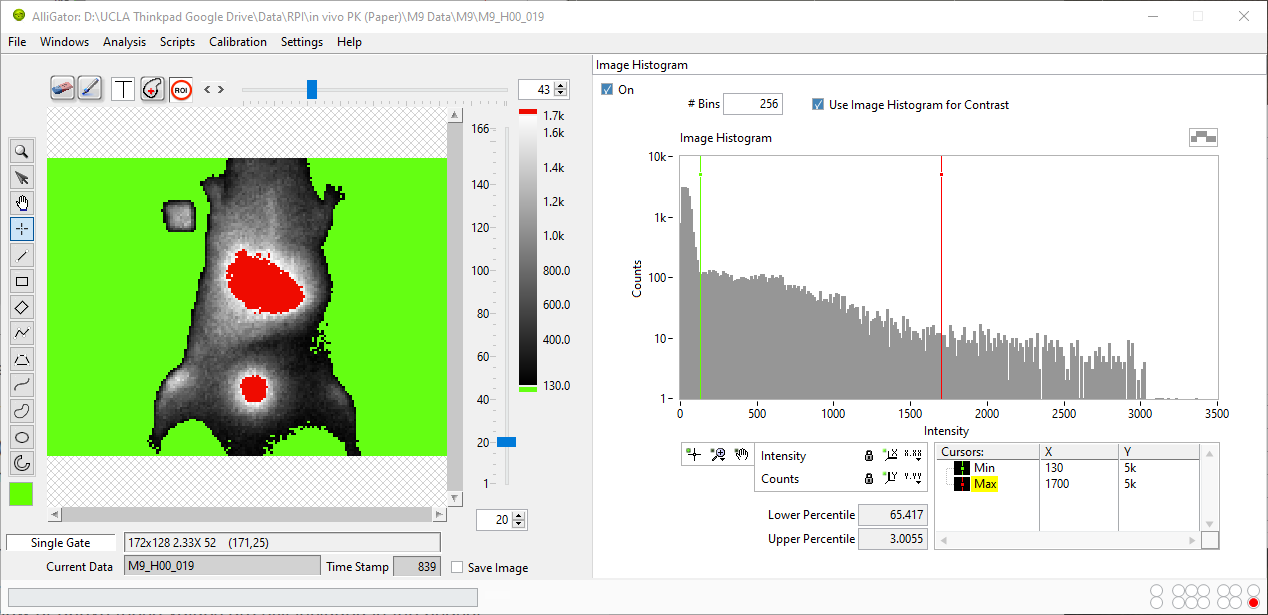
In the example below (using an older version of AlliGator), the main histogram
peak to the left corresponds to background pixels, which can be set to appear
green with the chosen position of the Min cursor (green) = 130 shown
below and setting the Lowest Color` to be green (a different color palette
-Grayscale- was selected to illustrate the effect of lowest and highest colors
distinct from the palette’s min and max colors) [1].
Likewise, moving the Max cursor below the max histogram value and chosing the
highest color to be red, highlights the two brightest regions of the sample
[2].
Note that this is only a display feature. Pixels below or above these values are still included in the phasor calculation, unless stated otherwise by the Reject Low count Pixels or Reject High Count Pixels checkboxes of the Settings:Source Image panel (see below).
Lower & Higher Percentiles
Lower Percentile: this indicator located at the bottom of the Image Histogram, represents the percentage of pixels whose values are smaller than the Min cursor location. In the image above, 65.4 % of all pixels in the image have a value smaller than 130.
Upper Percentile: this indicator located at the bottom of the Image Histogram, represents the percentage of pixels whose values are larger than the Max cursor location. In the image above, 3 % of all pixels in the image have a value larger than 1,700.
Intensity Thresholds
In order to use the information provided by the image intensity histogram to instruct the software to reject low or high intensity pixels, open up the Settings:Source Image panel:
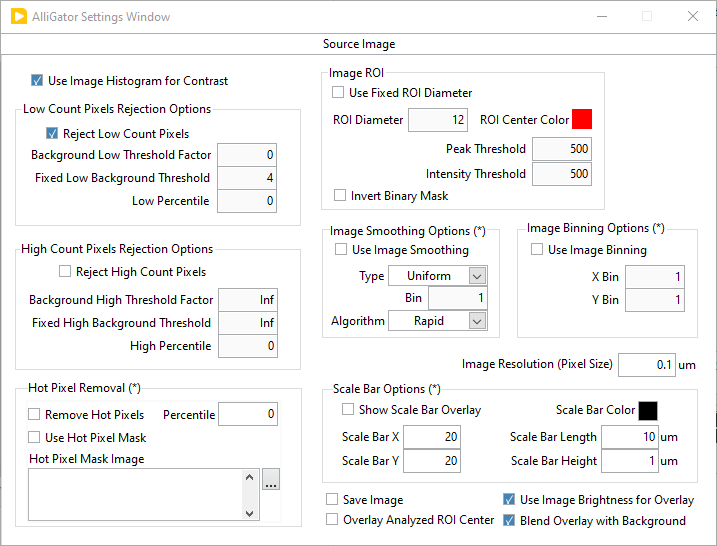
Two groups of controls can be used: Low Count Pixels Rejection Options and High Count Pixels Rejection Options.
Low Count Pixels Rejection Options
Reject Low Count Pixels: if unchecked, no low-count test is performed on any pixel. If checked, the next two controls are used for each pixels.
Background Threshold x Factor: when different from zero, any pixel in the sum image of a data set, with an intensity smaller than
A x P, whereAis the parameter’s value andPis the location of the sum image histogram peak, will be ignored when computing the fluorescence decay and phasor. For instance, a value ofA = 1means that all pixels with value below the image histogram peak position will be ignored, whileA = 0means that all pixels will be retained. A nominal value to exclude background pixels appears to beA = 3, but it is recommended to experiment, as histogram shape can vary from sample to sample. In particular, it may happen that the histogram peak does not correspond to the most likely background value.Fixed Background Threshold: complements the previous criterion, which may fail in some particular cases. This parameter
Bsimply sets the minimum value of a pixel in the sum image for its phasor to be computed and included in the Phasor Plot image, Phasor Graph and Fluorescence Decay calculations.Low Percentile: as an alternative to the two previous options, it is possible to define the minimum value of the Sum of All Gates in a pixel using this parameter
LP, to be compared to the Lower Percentile value. A valueLP = 0means that no constraint is applied.
The rejection criterion uses the maximum of A x P, B and the value
corresponding to the LP percentile of the histogram.
High Count Pixels Rejection Options
Reject HighCount Pixels: if unchecked, no high-count test is performed on any pixel. If checked, the next two controls are used for each pixels.
Peak Threshold x Factor: when different from zero, any pixel in the sum image of a data set, with an intensity larger than
K x M, whereKis the parameter’s value andMis the location of the sum image maximum, will be ignored when computing the fluorescence decay and phasor. For instance, a value ofK = 0.7means that all pixels with value above 70% of the maximum pixel intensity will be ignored, whileK = 1means that all pixels will be retained.Fixed Peak Threshold: complements the previous criterion. This parameter
Csimply sets the maximum value of a pixel in the sum image for its phasor to be computed and included in the Phasor Plot image, Phasor Graph and Fluorescence Decay calculations.High Percentile: as an alternative to the two previous options, it is possible to define the maximum value of the Sum of All Gates in a pixel using this parameter
HP, to be compared to the Upper Percentile value indicated at the bottom of the Image Histogram. A valueHP = 0means that no constraint is applied.
The rejection criterion uses the minimum of K x M, C and the value
corresponding to the HP percentile of the histogram.
Notes