Phasor Ratio Panel
Introduction
Phasor ratio analysis is a simple way to quantify the respective contribution of two species to a fluorescence signal, which is known to be a mixture of these two species. The last, emphasized part of this sentence is critical: while it is always possible to compute a phasor ratio given two references, there is no guarantee that the underlying decay is a linear combination of the two decays the references are the phasors of.
It involves defining two “reference” phasor points (check the Phasor Graph Panel manual page or the Phasor Plot Panel manual page to learn how to define phasor ratio references) and computing the fractional distance of the phasor of interest to one of these two references.
Loosely speaking, a phasor ratio equal to 0 corresponds to a sample identical to Reference 1 and a phasor ratio equal to 1 corresponds to a sample identical to Reference 2. More precisely, the phasor ratio is computed after orthogonal projection of the phasor to the segment connecting the two references. In this sense, a phasor ratio of 0 is obtained for all phasors on the line passing through reference 1 and perpendicular to the segment connecting both references. More details on the definition of the phasor ratio can be found in the literature [Col2012] , [Chen2018].
In favorable cases, the standard phasor ratio \(f_1\) is identical to the corresponding intensity fraction of the decay reference 1 is the phasor of, and can be related to the corresponding amplitude fraction \(\alpha_1\) of that decay, as discussed in the introduction to phasor references in the Phasor Graph panel manual page. The Settings:Phasor Graph panel has a checkbox (Phasor Ratio Type) allowing to choose which ratio (\(f_1\) or \(\alpha_1\)) to compute.
Phasor Ratio Graph
The Phasor Ratio graph of the Phasor Ratio panel receives the ouput of 3 right-click menu functions of the Phasor Graph described next. Simultaneously, the corresponding average lifetime value(s) is/are sent to the Lifetime & Other Parameters graph of the Lifetime & Other Parameters panel.
Computation of a single phasor ratio
An example of a typical situation is shown in the figure below.
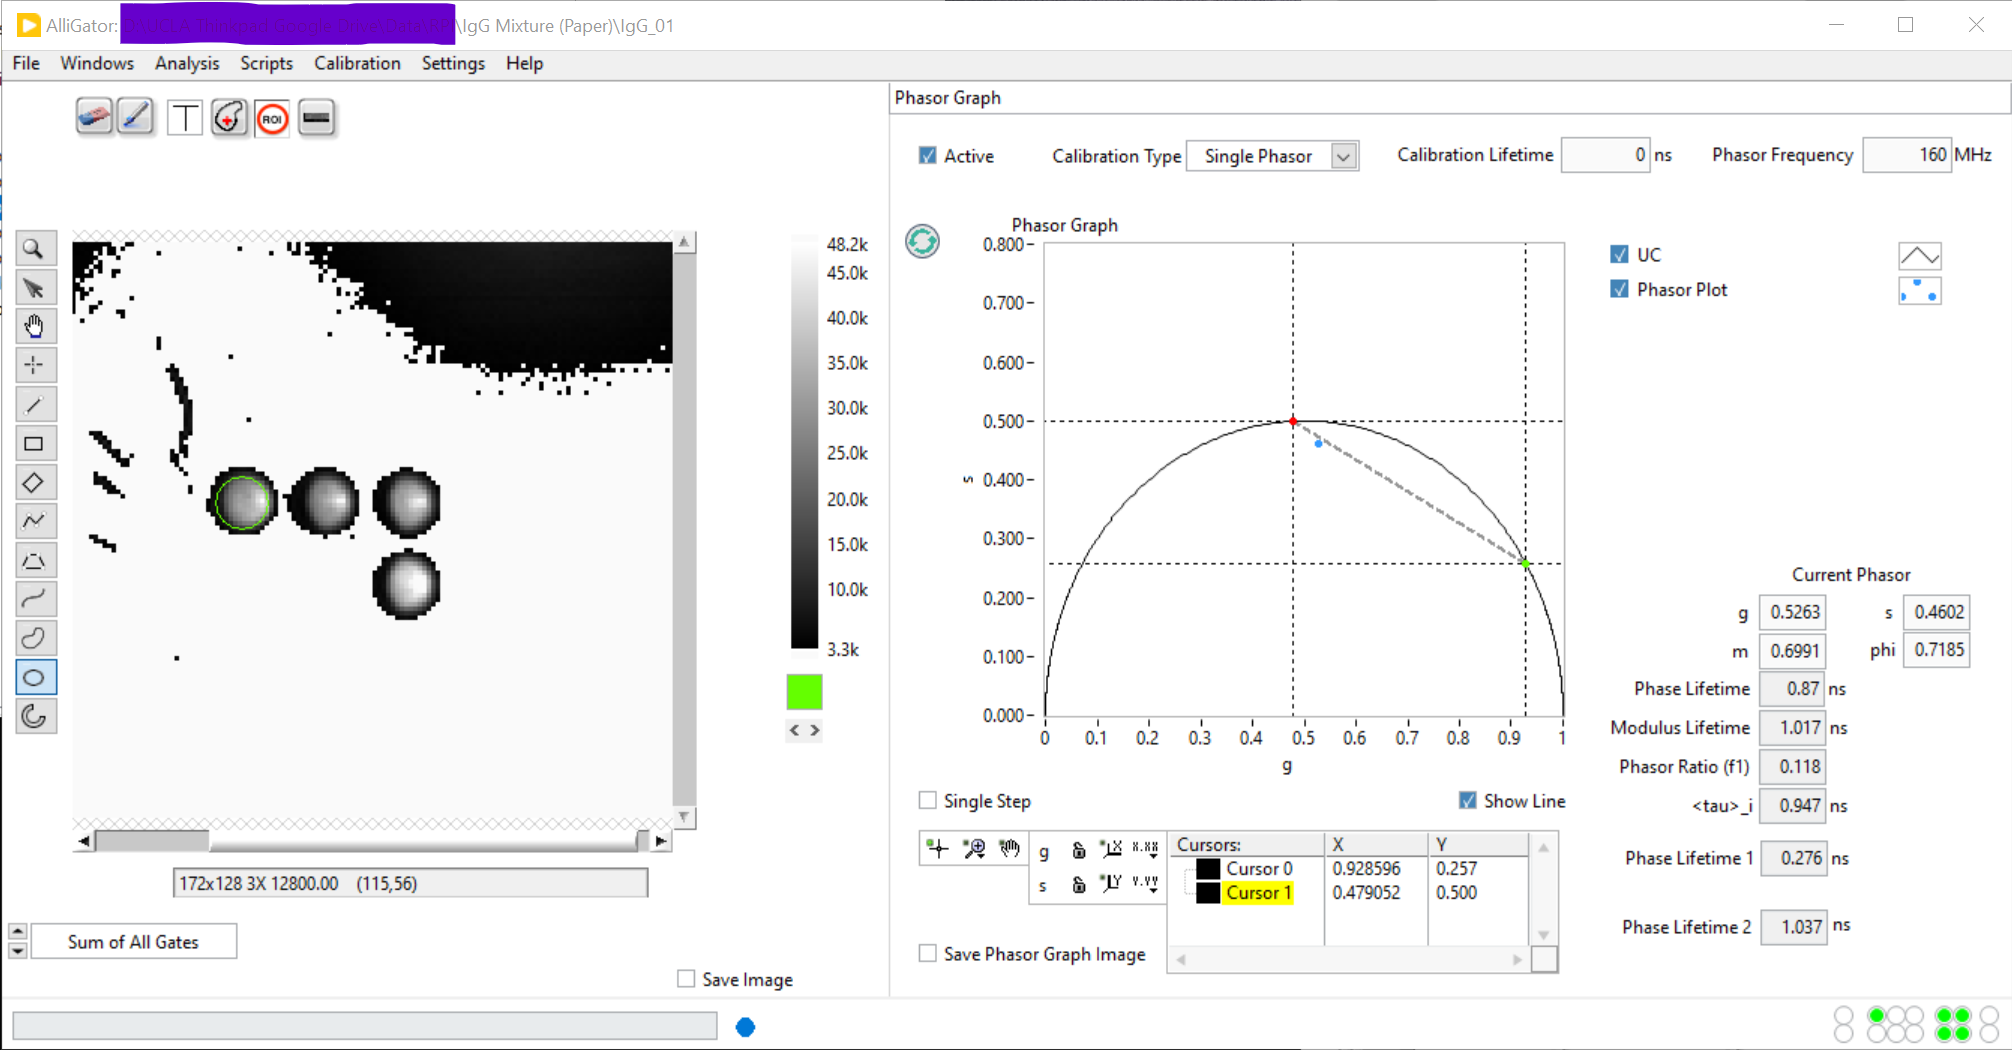
In this example, two phasor ratio references have been defined (green and red dot), corresponding to the intersections of the line connecting the first two cursors with the universal semicircle (UC).
The new (calibrated) phasor (blue dot) is located in between these two
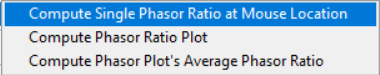
references. To compute its phasor ratio, right-click on (or close to) the
phasor and select Compute Single Phasor Ratio:
This opens a dialog window in which the user is invited to associate an horizontal coordinate (Sample Abscissa) to the computed phasor ratio:
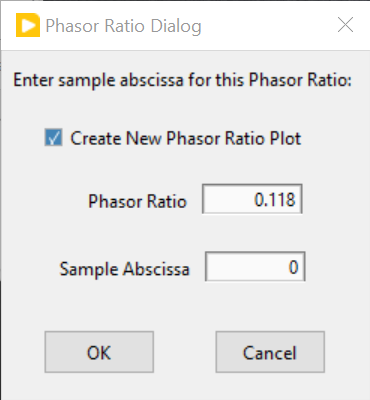
This value is user-defined and could for instance represent the known fraction of one component of a mixture.
The corresponding point is then added to the last plot in the Phasor Ratio graph of the Phasor Ratio panel.
Note that it is possible to create new plots in the Phasor Ratio graph by
right-clicking in it and select New Plot. This will create a new empty plot
in the graph, to which subsequent phasor ratios will be added. Alternatively,
check off the Create New Phasor Ratio Plot checkbox in the previous dialog
window.
This feature is useful to group phasor ratios from different data points into different groups (or plots).
Computation of a series of phasor ratios
Instead of manually computing the phasor ratios of individual data points, it
is possible to select a phasor plot in the Phasor Graph and use the
right-click menu function Compute Phasor Ratio Plot. The abscissa of
successive points in the corresponding phasor ratio plot will be 0, 1, etc. and
can easily be modified in the Plot Editor accessible via the context menu.
Another way to compute phasor ratios is by using the
Analysis:FLI Dataset Series:Series Phasor Analysis:Current ROI function.
When phasor references have been defined, this script automatically computes
the phasor ratio (and lifetime) of each data point, and add them to a new plot
in the respective graphs.
Computing the average phasor ratio of a phasor plot
It is possible to compute the average phasor ratio of a phasor plot in the
Phasor Graph (more precisely, compute the phasor ratio of the average phasor
of a series of phasors within a plot), by selecting the Compute Phasor Plot's
Average Phasor Ratio function in the Phasor Ratio Calculation right-click
menu of the Phasor Graph. As for the single phasor ratio calculation discussed
above, this opens up a dialog window.
Fitting a phasor ratio series to a line
The Linear Fit right-click shortcut menu can be called by clicking on the
desired plot’s legend. This will fit a line to the series of data point in this
graph and send the Slope and Intercept parameters of the fit to the
Notebook (as well as the Residue and number of data points n used in the fit).