Fluorescence Decay Statistics Panel
The Fluorescence Decay Statistics panel contains a Decay Statistics Graph and a few controls described below.
The Decay Statistics Graph shows pairs of histograms (Max Values and Min
Values) computed when the Analysis:Fluorescence Decay Statistics menu item
(Ctrl+D) is activated.
These histograms are respectively the histogram of min values in each pixel’s
fluorescence decay and the histogram of max values in each pixel’s fluorescence
decay.
Computation of these histograms takes time (and can be aborted by pressing the Abort button appearing during computation) since it involves extracting the fluorescence decay in each pixel of the dataset and determining its min and max value. An example of such a pair of histograms is shown below.
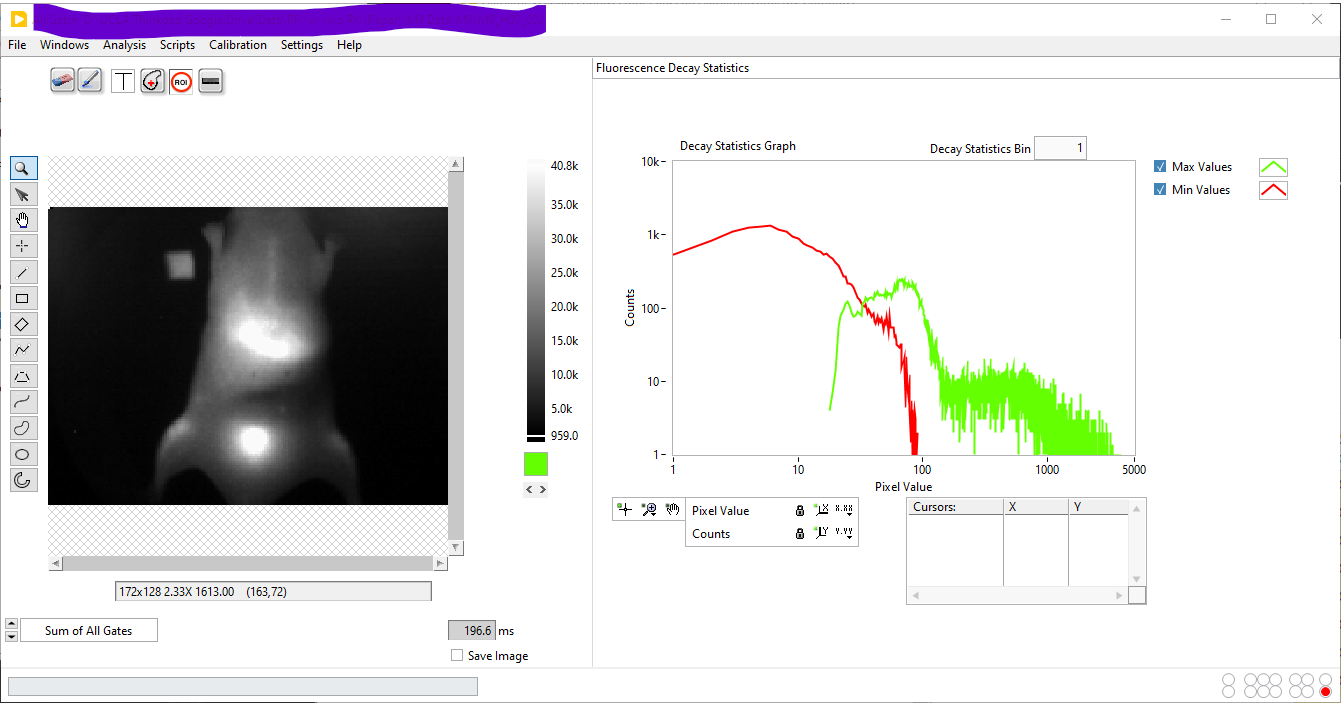
Notice that the Log-Log representation used in the above figure is optional, but is convenient due to the generally large spread of values. The same histograms as above, built using a linear representation (and using a Decay Statistics Bin value of 10) is shown below for comparison:
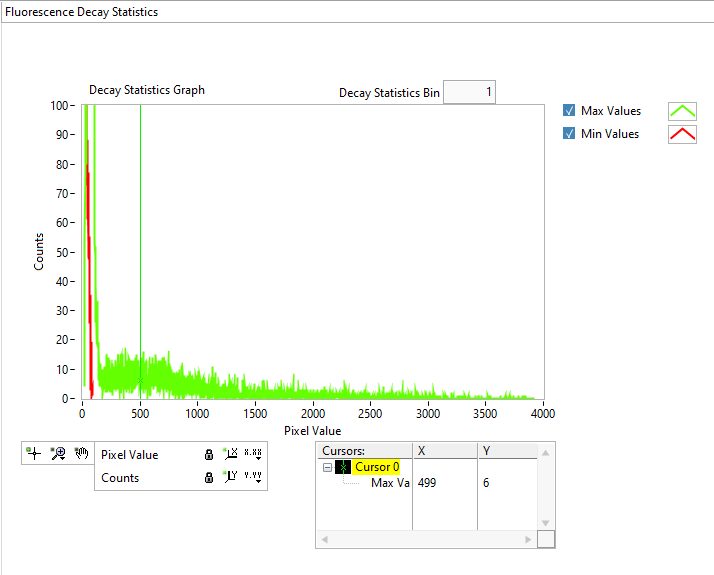
These histograms can be used to define ROIs based on the Peak Threshold value
defined in the Image ROI section of the Settings:Source Image panel,
using the Define ROI(s) above Mean Peak Source Image menu item described
in the Using ROIs manual page.
The Min Values histogram indicates the baseline (minimum of the decay) values within the dataset, while the Max Values histogram indicates how many pixels have values above the Peak Threshold criterion. For instance, in the example shown above, the minimum decay peak value enforced (499, green cursor) is above the main peak of the Max Value histogram, ensuring that only the brightest pixels will be retained and background pixels rejected.