Decay Fit Parameters Map Panel
The Decay Fit Parameters Map panel is used to display and further process multi-ROI NLSF results (and can be used to display results from a Python plugin if needed).
The panel consist of different controls and indicators as illustrated below and discussed next.
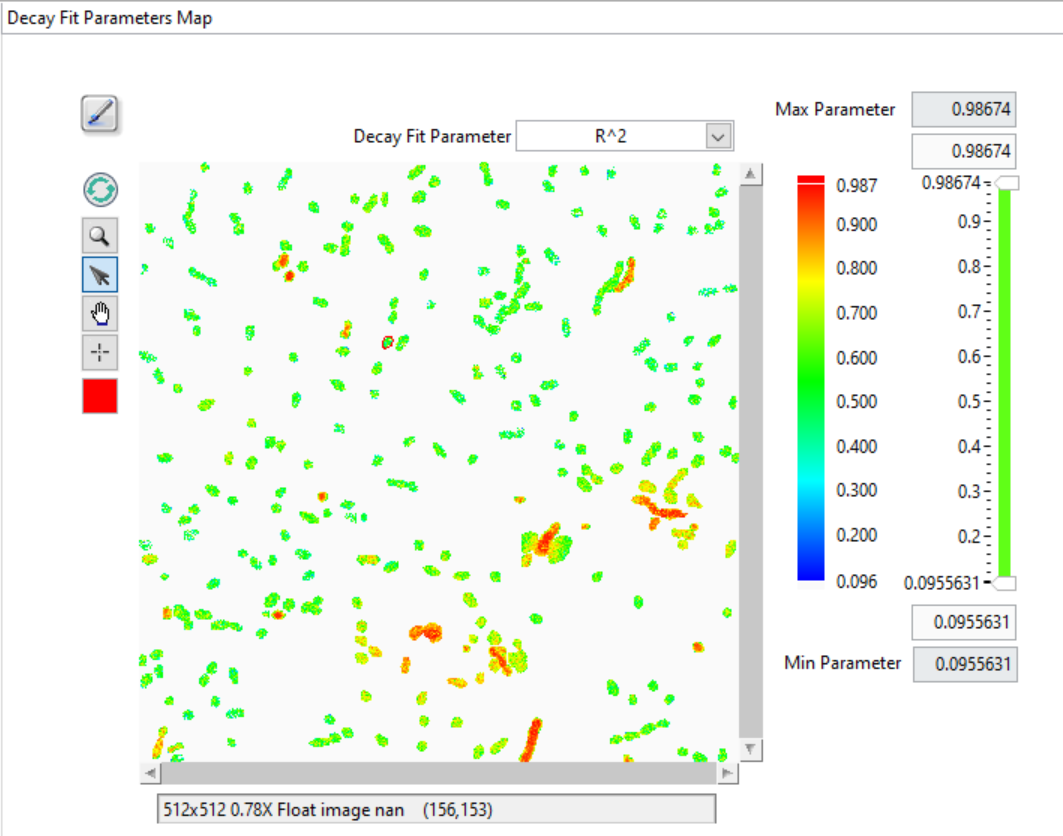
The main object is the map itself, which represents a color-coded image of the selected parameter (Decay Fit Parameter pull-down list at the top right), based on the selected Decay Fit Parameter Map Color Scale (next to the map) and the values of the DEcay Fit Parameter Map Display Range (to the right of the color scale).
The Max Parameter and Min Parameter indicators provide the actual total range of the computer parameters, while the controls immediately aboce and below the slide represent the position of the sliders, which themselves specify what are the selected Min and Max of the displayed parameters.
Any parameter above or below these two limits are color-coded with the unique color boxes located at the top and bottom of the color scale (by default, the bottom color is white, and is therefore not readily localized. Left-click right below the color scale to reveal the color picker window and select the color highlighting parameters below the display range minimum).
The square Tools buttons on the top left of the Decay Fit Parameters Map allow zooming, selecting, moving or clicking the image or a ROI.
The Refresh Parameter Map forces redrawing the map, while the square color selector at the bottom allows defining the color of the ROIs drawn over the map.
Finally, the Overlay Parameter Map button at the top left (brush tool) enables overlaying the current Decay Fit Parameters Map in the Source Image.
Decay Fit Parameter Map Menu
The Decay Fit Parameters Map context menu is shown below and discussed next.
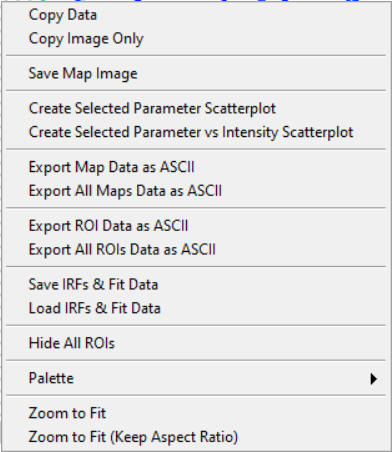
Copy Data: This copies the LabVIEW image object bitmap, including tool palette, scroll bars, and image information.
Copy Image Only: Only copies the visible image.
Save Map Image: Saves the whole image as a ONG file (with dialog).
Create Selected Parameter Scatterplot: Sends all parameter values P_i in the image as a (i, P_i) scatterplot in the Lifetime & Other Parameters Graph of the Lifetime & Other Parameters panel, where i is the index of ROI.
Create Selected vs Intensity Scatterplot: Sends all parameter values P_i in the image as a (I_i, P_i) scatterplot in the Lifetime & Other Parameters Graph of the Lifetime & Other Parameters panel, where I_i is the decay intensity (either baseline-subtracted or not, depending on the user’s response to the pop-up dialog.
Export Map Data as ASCII: This will export the current map image as an ASCII matrix of parameter values. If only a few of the image pixels have actual parameters associated with them, this will result in a mostly
NaN-filled file, with a few isolated actual values.Export All Maps Data as ASCII: This will export all paraneter map images as separate ASCII matrices of parameter values.
Export ROI Data as ASCII: This function exports all parameters for the selected ROI. Note however that there are 3 different use cases:
If the the ROIs used to compute the map are all single-pixels and the selected ROI is a single-pixel ROI, this will export a single row of parameters, preceded by the ROI index and pixel coordinates.
If the the ROIs used to compute the map are not all single-pixels and the selected ROI is one of the original ROIs used for computing the map, this will export a single row of parameters, preceded by the ROI index and pixel coordinates.
Possibly more interesting, if the the ROIs used to compute the map are all single-pixels but the selected ROI is not, this will export multiple rows of parameters corresponding to the different pixels in that ROI, preceded by the ROI index and pixel coordinates.
Export All ROIs Data as ASCII: Similarly to the previous one, this function exports all parameters for all the ROIs. Again, tthere are 3 different use cases:
If the the ROIs used to compute the map are all single-pixels and the ROIs are also single-pixel ROIs, this will export multiple rows of parameters, preceded by the ROI index and pixel coordinates.
If the the ROIs used to compute the map are not all single-pixels and the ROIs are the original ROIs used for computing the map, this will export multiple rows of parameters, preceded by the ROI index and pixel coordinates.
Possibly more interesting, if the the ROIs used to compute the map are all single-pixels but the ROIs used are not, this will export multiple rows of parameters corresponding to the different pixels in these ROI, preceded by the ROI index and pixel coordinates.
Save IRFs & Fit Data: This saves all the data generated during the fit, as well as the IRFs in a HDF5 file. It is the recommended quick way to save the outcome of an analysis and allows revisiting the results with the help of the next function.
Load IRFs & Fit Data: This allows reloading the output of an analysis and work with it (see next) together with the loaded dataset (the dataset is not loaded, neither are the ROIs, which needs to be done separately, if needed.
The other functions are self-explanatory.
Note that when a series of parameters maps have been calculated, it is possible to visualize the outcome of the fits in a given ROI by opening the Local Decay Graph window. This will display the local decay, fit, residuals and IRF, as well as output the fit parameters in the lower panel of the window.