AlliGator Window
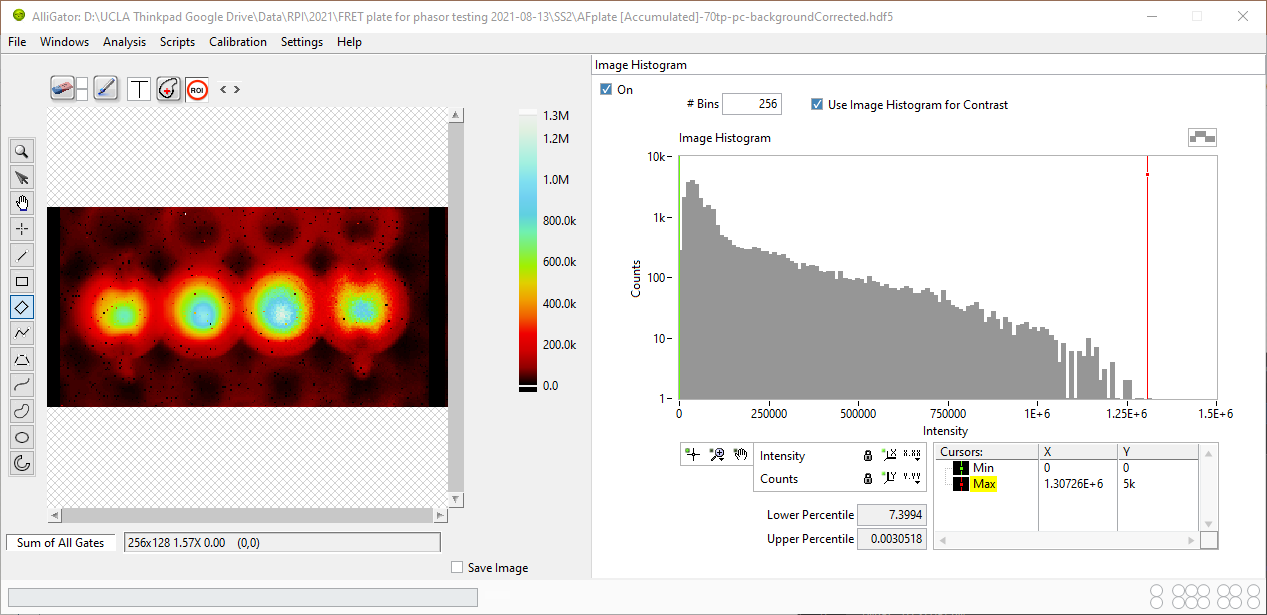
AlliGator’s main window (figure below) shows the source dataset intensity image on the left-hand side, and one of many different analysis panels on the right-hand side (the Image Histogram panel is shown in the figure). The pull-down list on the top right (aka panel selector) allows selecting which analysis panel is displayed.
AlliGator Panels
The following panels are available:
Each panel’s function is discussed in a separate manual page (see the table of content on the left).
A standard menu bar on the top left gives access to different functions, which are sometimes associated with a AlliGator Shortcuts. The different menus are discussed in separate sections of the manual.
The main window can be resized in order to increase the Source Image size. The right-hand side panels do not resize laterally but expand vertically (their content is not resized).
Analysis Status Indicator LEDs
LEDs located on the bottom right of the panel indicate at a glance which parameters or options have been defined, or some user action is required. To see which option they correspond to, hover over each of them and wait for a tip strip to show up.
From left to right, they are:
Top row
Reference/IRF Defined
Phasor Calibration Defined
Phasor Calibration Series Defined
Phasor Calibration Map Defined
Phasor Ratio Reference 1 Defined
Phasor Ratio Reference 2 Defined
Dataset Update Needed
Bottom row
Individual IRFs Defined
Phasor Calibration Used
Phasor Calibration Series Used
Phasor Calibration Map Used
Phasor Ratio Lifetime Reference 1 Defined
Phasor Ratio Lifetime Reference 2 Defined
Phasor Plot Update Needed