Shot Noise Influence on Average Lifetime
This tool allows simulating the effect of a finite signal on the amplitude-averaged lifetime uncertainty (for a definition of this quantity, see the Exporting Additional Phasor Quantities section of the Phasor Graph Panel page of the manual.
The controls visible in this window are described next.
Phasor Parameters comprise:
Frequency: harmonic frequency used for the calculations
tau 1: first phasor ratio reference
tau 2: second phasor ratio reference
f1: amplitude fraction of the first reference in the decay
Simulation Parameters comprise:
# Photons: number of photons simulated for each decay
Decay Bin Size: size of the bins used to convert raw photon arrival times into an hisotgram (decay)
# Simulations (N): number of simulations used to estimate the average lifetime standard deviation
# Replicas (M): number of replicas of each decay used to emulate the analysis performed in AlliGator.
Histogram Parameters (top right):
Histogram Bin Size (Lifetime): size of the bin used to build the average lifetime histogram.
Histogram Bin Size (SDV): size of the bin used to build the average lifetime standard deviation histogram.
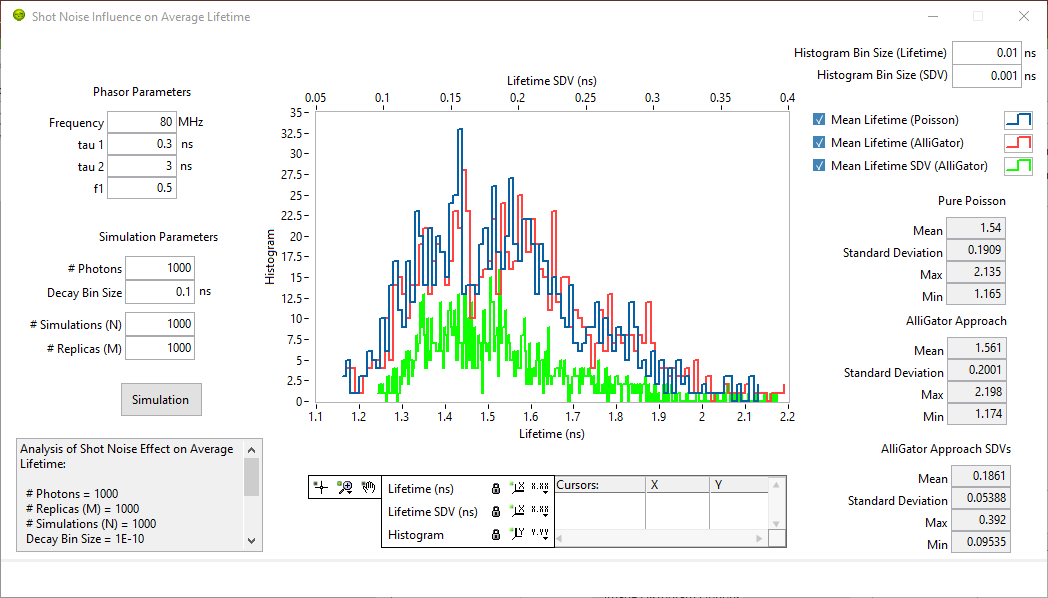
A simulation, run by clicking on the Simulation button, consists in simulating N decays comprised of # photons photons each, distributed according to a bi-exponential probability distribution function specified by the Phasor Parameters and calculating the amplitude-average lifetime for each of them. A Mean Lifetime (Poisson) histogram is created and plotted, and the corresponding statistics displayed in the Pure Poisson indicator to the right.
Simultaneously, for each simulated decay, M replicas are generated in the same way they are simulated in AlliGator (see the Shot Noise-limited Standard Deviations section of the:ref:alligator-phasor-graph-panel page of the manual). From these replicas, the mean average lifetime and its standard deviation are calculated. The N corresponding mean average lifetimes and standard deviations are histogrammed (AlliGator Approach and AlliGator Approach SDVs) and the corresponding statistics displayed.
Note
The lifetime histograms are associated with the bottom horizontal scale while the standard deviation histogram is associated with the top horizontal scale. All histograms share the same vertical scale.
These results are also ouput in a text format in the text box no the bottom left of the panel and sent to the Notebook. Standard graph functions can be used via the right-click menu.
The purpose of these simulations is twofold. On one hand, estimate the standard deviation of the calculated amplitude-averaged lifetime when dealing with decays with a given number of photons (the first output). On the other hand, compare this result to the AlliGator estimate of the shot noise-related amplitude-averaged lifetime uncertainty obtained by “replicating” the experimental decay to obtain similar decays but with similar photon counts (the second output).
In general, the two histograms are very similar, justifying the approach used in AlliGator to estimate the influence of shot noise on the calculated amplitude-averaged lifetime.