Selected Plot Style Window
The Set Style of Selected Plots custom graph menu item opens up the following Plot Style Dialog window:
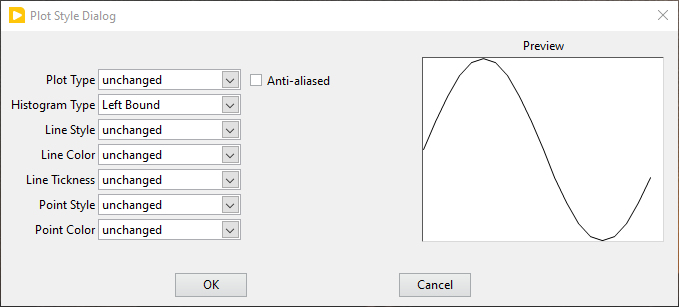
The Preview panel on the right will illustrate what plot style has been defined using the list of controls on the left.
These controls try to reproduce the options normally available for individual plots using the right-click menu associated with each plot’s icon in the Graph, with some modifications. Importantly, the selected style(s) will be applied to all selected plots.
Notice that most of the selected style options are unchanged in the above snapshot. This means that the corresponding component of the plots’ styles will not be changed. However, the Histogram Type parameter has been chosen to be Left Bound. The result of pressing OK will be that all selected plots which are “histograms” will be left-justified, while other plots will remain unchanged.
Most of the options are self-explanatory, but the two Color options (Line Color and Point Color) offer the flexibility needed for series of plots:
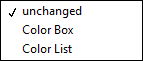
The Color Box option will show a color box next to the option, allowing to apply the selected color to all plots (either the line color or the point color, or both).
Selecting the Color List option will show a pull-down list next to the option. If it contains some color list names, one of them can be selected. Otherwise, right-clicking on the list will show the following menu:
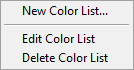
Edit Color List and Delete Color List are self-explanatory.
Selecting New Color List... opens the following dialog window:
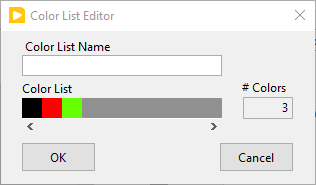
Clicking on individual Color Boxes in the linear array visible in the center, allows defining a series of colors. This series will be repeatedly applied to the selected plots when leaving the Plot Style Editor. It is recommended to give each user-defined color list a distinctive name for future use (these lists are saved with AlliGator Settings, therefore they are available from one run to the next).
To store the edited list, click OK and then OK in the Plot Style Editor window to apply the selected styles.
To leave the selected plots untouched, simple click on Cancel or close the Plot Style Editor window.