AlliGator Menus
Some of AlliGator’s functions can be performed via the top menu bar (and associated shortcuts). The menus are File, Windows, Analysis, Calibration, Settings and Help
File Menu
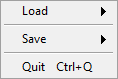
LoadFLI DatasetGate Image Folder: is used with data consisting of series of images.HDF5 File: allows loading a dataset saved in the HDF5 open source file format used by AlliGator..sdt File: loads Becker & Hickl histogrammed FLIM file..ptu File: loads PicoQuant TCSPC FLIM file..bin File (PicoQuant Binned): loads PicoQuant histogrammed FLIM file..bin File (Piccolo Binned): loads Piccolo detector histogrammed FLIM file.SwissSPAD 1 .dat File: loads a file generated by the first generation SwissSPAD camera.Reload Dataset: forces reloading the current dataset (used to apply new settings).
FLI Dataset SeriesGate Image Folder Series: is used with folders of folders of data consisting of series of images.HDF5 File Series: allows loading a folder of datasets saved in the HDF5 open source file format used by AlliGator..sdt File Series: loads a folder of Becker & Hickl histogrammed FLIM files..ptu File Series: loads a folder of PicoQuant FLI files.bin File Series (PicoQuant): loads a folder of PicoQuant histogrammed FLIM files..bin File Series (Piccolo): loads a folder of Piccolo histogrammed FLIM files.
White Light Image: opens a single image of the sample (or any other image) which will not be used for data analysis.Mask Image: opens a mask image used to define regions of interest for data analysis.Intensity Corrections File: opens a file containing corrections to apply to intensity values in the series.
SaveDatasetSave as TIFF Gate Image Folder: saves gate images loaded in AlliGator as TIFF files.Save as HDF5 FLI Dataset: saves any file loaded in AlliGator in the open source file HDF5 format used by AlliGator.
Mask Image: saves the current Mask Image to a TIFF file.
Batch Conversion: opens a window allowing the selection of multiple FLI Datasets and exporting them to HDF5 FLI Dataset files or TIFF Image Series.CloseFLI Dataset: dispose of all the data corresponding to the current dataset.FLI Dataset Series: dispose of all the data cprresponding to the current dataset series.White Light Image: dispose of the current white light image.Mask Image: dispose of the current mask image.Intensity Correction File: clears intensity corrections.
Quit(Ctrl+Q): quits AlliGator with confirmation, offering to save the Notebook content (Ctrl+Q).
Windows Menu
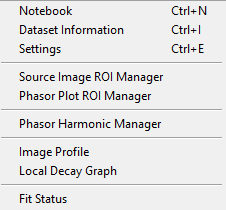
Notebook: opens the Notebook window (Ctrl+N).Dataset Information: opens the Dataset Information window (Ctrl+I).Settings: opens the Settings window (Ctrl+E).Source Image ROI Manager: opens the Image Source ROI Manager window (Ctrl+Shift+R).Phasor Plot ROI Manager: opens the Phasor Plot ROI Manager window.Phasor Harmonic Manager: opens the Phasor Harmonic Manager window.Histogram: opens the Histogram window.Image Profile: opens the Image Profile window.Local Decay Graph: opens the Local Decay Graph window.
Analysis Menu
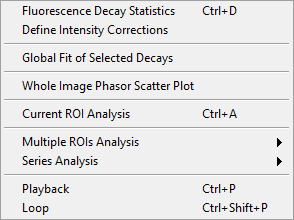
FLI DatasetCurrent ROI Analysis: performs an analysis of the pixels located within the selected ROI or, if theUse ROI as Search Areabutton is pressed, in the optimal ROI within that region (Ctrl+A).Multiple ROIs AnalysisAll ROIs IRF ExtractionInteractive (Slow): performs the same analysis asCurrent ROI Analysison all ROIs currently defined, in the order they appear in the ROI Manager. In particular, it will plot the corresponding decay, add a data point to a new phasor plot in the Phasor Graph and display the current location of the ROI. This can take quite a long time in the case of a very long list of ROIs or for large datasets.Non-interactive (Fast): performs the same analysis asCurrent ROI Analysison all ROIs currently defined, in the order they appear in the ROI Manager. No decay is plotted, the phasor plot resulting from the analysis in only displayed at the end, and no ROI is displayed on the Source Image during the analysis. This mode is recommended, as it is much faster than the previous one (> x10).
All ROIs NLSF AnalysisInteractive (Slow): this function is described in the Multiple ROIs Decay Fit section of the Fluorescence Decay Fitting manual page.Non-Interactive (Fast): see item above.
All ROIs Phasor AnalysisInteractive (Slow): this function computes the decays of all ROIs, displays them in the Decay Graph, computes their phasors, applying a phasor calibration if this option is selected, and displays the corresponding phasors in the Phasor Graph as a single phasor plot. Because this analysis is done sequentially and displays all decays, it can be resource consuming and slow. If the decays are not needed, it is recpmmended to use the next function instead.Non-Interactive (Fast): this function performs the same task as the previous one, but does not plot the ROI decays, and perform the analysis in parallel, significantly reducing the resources needed and the analysis duration.
All ROIs Average Lifetime: creates a plot of approximate average lifetime for each ROI decay using the integral of the decay, corrected for the estimated contribution of the IRF (gommon or local, depending on the Use Local IRF option of the Settings:Fluorescence Decay: Fit Options panel). The corresponding plot is sent to the Lifetime & Other Parameters Graph of the Lifetime & Other Parameters panel.
Multiple ROIs Single-Pixel AnalysisAll ROIs Single-Pixel NLSF Analysis: this script is discussed in the NLSF Analysis section of the All ROIs Single-Pixel Analysis manual pageAll ROIs Single-Pixel Phasor Analysis: this script is discussed in the Phasor Analysis section of the All ROIs Single-Pixel Analysis manual page
Compute Fluorescence Decay Statistics: analyzes all single pixel decays within the data set and builds an histogram of the minimum and maximum intensity in each decay. This analysis is discussed in more details in the Fluorescence Decay Statistics page of the manual
FLI Dataset SeriesSeries Phasor AnalysisCurrent ROI: the same ROI is used for all datasets in the seriesAll ROIs: not supportedSequential ROIs: the ROIs in the ROI Manager list are used sequentially for each dataset in the series (i.e. the first ROI is usd for the first dataset, the second ROI for the second dataset, etc.).
Series NLSF AnalysisCurrent ROI: the same ROI is used for all datasets in the seriesAll ROIs: not supportedSequential ROIs: the ROIs in the ROI Manager list are used sequentially for each dataset in the series (i.e. the first ROI is used for the first dataset, the second ROI for the second dataset, etc.).
Series Sum or AverageSum All FLI Datasets in Series: the same ROI is used for all datasets in the seriesShow FLI Dataset Series Sum: displays the sum of all datasets in the Source ImageShow FLI Dataset Series Average: displays the average of all datasets in the Source Image
Define Intensity Corrections: opens the Define & Save Intensity Correction File dialog window discussed in the Intensity Corrections Definition manual pagePlayback: successively loads every dataset in the loaded series, stopping when the end of the series is reachedLoop: successively loads every dataset in the loaded series, starting back from the first dataset when the end of the series is reached
Source ImageSource Image Plugin ExampleIntensity Above Threshold Mask: python plugin example
Decay GraphDecay Graph Plugin ExamplePlot Scaled Sum and Difference (Selected Plots) test
Process Multiple PlotsLinear Combination (Selected Plots)
Process PlotPlot Mean SDV
Phasor Plot: no default itemPhasor Graph: no default itemDecay Fit Parameter Map: no default itemToolsShot Noise Influence on Average Lifetime: opens the Shot Noise Influence on Average Lifetime window described in the corresponding page of the manualFit Method Benchmark: opens the Fit Method Benchmark window described in the corresponding page of the manual
Scripts Menu
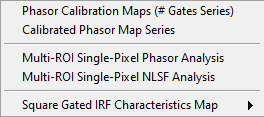
Phasor Calibration Maps (# Gates Series): computes phasor calibrations maps for different step parametersCalibrated Phasor Map Series: computes calibrated phasors plots for a series of dataset/gate step/calibration mapSquare Gated IRF Characteristics Map: fits ROI decays with one of the following gate models:Square PulseLogistic Square PulseTilted Logistic Square Pulse
Calibration Menu
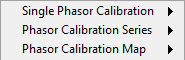
The menu is comprised of three sub-menus:
Single Phasor CalibrationUse Single Phasor Calibration: performs the same action as selectingSingle Phasorin the Calibration Type pull-down list in the Phasor Graph panel. Both are linked (the pull-down list is updated when the menu item is selected and vice versa).Save Phasor Calibration: saves the currently used single calibration phasor to a XML file.Load Phasor Calibration: loads a previously saved calibration phasor,Clear Phasor Calibration: removes the stored calibration from memory.
Phasor Calibration SeriesUse Phasor Calibration Series: performs the same action as selectingPhasor Seriesin the Calibration Type pull-down list in the Phasor Graph panel. Both are linked (the pull-down list is updated when the menu item is selected and vice versa).Save Phasor Calibration Series: saves the currently used calibration phasor curve to a XML file.Load Phasor Calibration Series: loads a previously saved calibration phasor curve,Clear Phasor Calibration Series: removes the stored calibration curve from memory.
Phasor Calibration MapUse Phasor Calibration Map: performs the same action as selectingPhasor Mapin the Calibration Type pull-down list in the Phasor Graph panel. Both are linked (the pull-down list is updated when the menu item is selected and vice versa).Save Phasor Calibration Map: saves the currently used calibration phasor map to a XML file.Load Phasor Calibration Map: loads a previously saved calibration phasor map,Clear Phasor Calibration Map: removes the stored calibration map from memory.
Help Menu
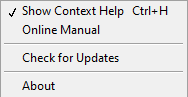
Show Context Help: shows a floating window providing basic information on the object pointed at with the mouse pointer (Ctrl+H).Online Manual: opens a page in the default browser redirecting to this website.Check for Update: visits the Installation webpage to check the latest released version. If a newer version is found, the software offers to download and install it. The new version will be used on the next time AlliGator is started.About AlliGator: opens a dialog window providing basic information on AlliGator.