Regions of Interest
Regions of interest (ROIs) are defined by a closed contour and can be created in different ways:
by drawing them using the drawing tools (to the left of the image)
by loading a ROI Mask image (this only works for the Source Image)
by pasting a text ROI description
using the Define ROI(s) above Min Peak context menu of the Image Source
These approaches are described below.
Drawing a ROI
There are a few default shape categories available on the left hand side of the image to draw ROIs:
Rectangle
Tilted Rectangle
Polygon (double-click the last point to finish and close the shape)
Free Form
Oval
Annulus
To draw a ROI comprising several shapes, hold the Ctrl key down while
drawing the successive shapes.
ROIs are represented as a special kind of overlay on top of the image and can be
manipulated using the Selection tool:

This tool acts as either a resizing tool or as a moving tool.
Managing ROIs
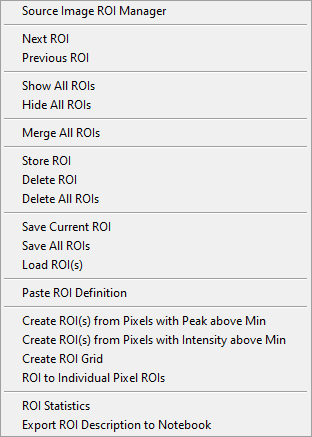
ROIs can be managed using the ROIs context menu functions:
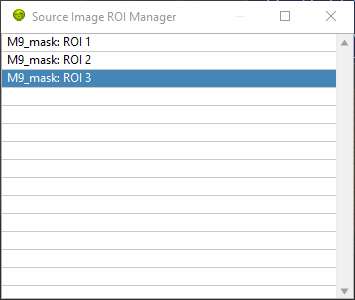
Source ROI Manager
The ROI manager is a floating window used to select stored ROIs by name:
ROI names can be modified by clicking on an already selected ROI name, making it editable (when the background turns black):
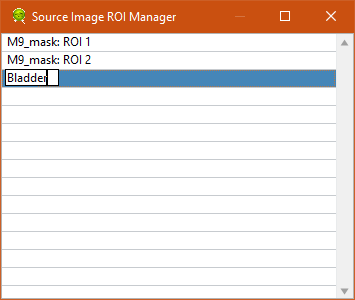
If the modified name is already used by another ROI in the list, a number is automatically appended to the name.
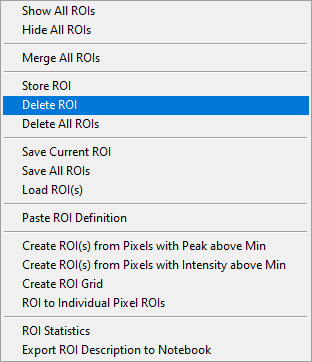
It is also possible to delete or save ROIs from within the ROI manager using the right-click menu (see ROI Saving/Loading below).
It is also possible to navigate through the different stored ROIs using the navigation buttons described next.
ROI Navigation
In addition to the ROI Manager window, it is possible to cycle through the
stored ROIs using the two little arrow heads/navigation buttons located to the
right of the Overlay Mode button above the Source Image:

Alternatively, use Next ROI or Previous ROI in the right-click menu of
the Source Image ROI Manager to the same effect.
ROI Display
To hide the visible ROI(s), select Hide All ROIs. Contrary to the
Delete All ROIs function discussed next, this does not destroy the stored
ROI(s).
ROI(s) can be displayed again by either using the ROI Navigation buttons or by selecting a ROI in the ROI Manager window.
To show all stored ROIs, select Show All ROIs. Note that this does not
select any new or different ROI.
ROI Storage
ROI Storage
A ROI can be used right after it has been defined, but any click elsewhere in the image with a ROI-modifying tool (selection or drawing tool) will erase it.
To avoid this, you can store the ROI after it has been defined by using the
Store ROI right-click menu item.
To remove a ROI from memory, cycle through the ROIs to show it and use
Delete ROI.
To remove all ROIs from memory, use Delete All ROIs.
Saving and Loading ROIs
To save a ROI for future use, it is possible to save it as a file using
ROIs->Save Current ROI. Use a self-explanatory name to simplify the task of
finding the appropriate ROI next time you need it. The file extension is
automatically set to .roi.
It is also possible to save all ROIs in a single file, using Save All ROIs.
The corresponding file extension is automatically set to .roiN.
To load a saved ROI (or multiple ROIs saved together), use Load ROI.
It is also possible to define ROIs using a binary image as described in a later section.
Note: Prior to version 0.17, a XML file format was used, which turned out to be a bit verbose and slow to load. From 0.17 onward, the file format was changed to JSON to mitigate these issues. Older XML files can still be loaded, but it is recommended to save them (e.g. overwriting the older version) in the new format.
Importing ROI description
Another method to create a ROI is to copy/paste a text description of a ROI generated by AlliGator and output to the Notebook during analysis. This is particularly convenient if a user has saved the Notebook after data analysis, but either failed to store and save the different ROIs used, or the corresponding files are not available.
To recreate a ROI from its description, simply select it in and copy it from the
Notebook (or another text editor), and moving to the ROI Manager,
right-click and select Paste ROI Definition. If the definition is valid,
this will create a new ROI and add it to the ROI Manager’s list.
For instance, here is a ROI definition representing an ellipse:
Number of pixels: 2728
Global Rectangle (LT, BR): (234, 211), (278, 273)
Number of Contours: 1
Contour 1: Oval
Points: (234, 211), (278, 273)
ROI Definition
Defining ROI(s) by a decay peak threshold
The Source Image panel of the Settings window has a parameter named
Peak Threshold. This parameter relates to the maximum value of the single
pixel decay (peak value).
It is possible to define ROI(s) based on pixels whose peak value is larger than
this Peak Threshold by using the right-click menu Create ROI(s) from
Pixels with Peak above Min.
[The appropriate value to use can be estimated by an analysis of the Fluorescence Decay Statistics histograms computed in the corresponding panel (see the corresponding manual page: Fluorescence Decay Statistics Panel)].
The result of this operation is one or more ROIs meeting this criterion. The ROIs are stored and added to the pool of existing ROIs.
Defining ROI(s) by an image intensity threshold
The Source Image panel of the Settings window has a parameter named
Intensity Threshold.
It is possible to define ROI(s) based on pixels whose total intensity is larger
than this Intensity Threshold by using the right-click menu
Create ROI(s) from Pixels with Intensity above Min.
[The appropriate value to use can be estimated by an analysis of the Image Histogram computed in the corresponding panel.
The result of this operation is one or more ROIs meeting this criterion. The ROIs are stored and added to the pool of existing ROIs.
ROI Grid
This menu item opens up a dialog allowing the definition of a series of rectangular ROIs arranged in a grid pattern:
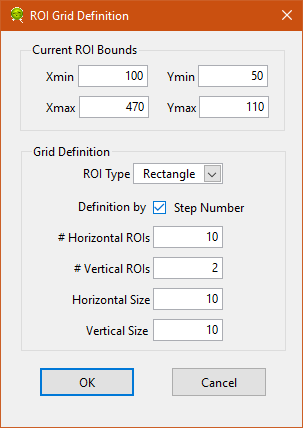
If a ROI is displayed in the Source Image, its bounding box definition will
be used as Current ROI Bounds parameters. Otherwise, define the bounding
rectangle for the grid:
(Xmin, Ymin) = coordinate of top-left corner (Xmax, Ymax) = coordinates of bottom-right corner
The Grid Definition cluster of parameters is used to define the type,
number and size of the individual ROIs arranged on the grid. The grid can be
defined either in terms of Step Size or Step Number, depending on the
Definition by checkbox.
Using the definition shown above results in the following set of ROIs:
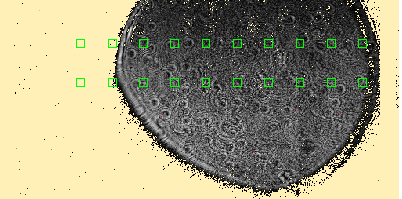
The corresponding ROIs are added to the ROI list (visible in the ROI Manager
window), with names of the kind: Type ROI (X,Y)+(W,H), where Type is
the ROI type (Point, Rectangle or Oval), (X,Y) are the coordinates of the
top-left corner of the ROI and (W,H) are the width and height of the ROI.
Note: To see all ROIs as in the figure above, use Show All ROIs in the
Source Image context menu.
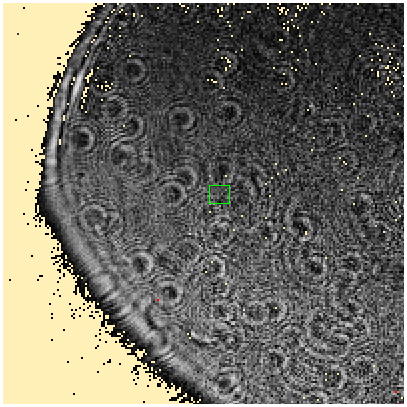
Convert ROI to Individual Pixel ROIs
To obtain all individual pixel decays within a ROI, it is possible to create
“single pixel” ROIs for all pixels within that ROI with the
ROI to Individual Pixel ROIs function.
The individual pixel ROIs are added to the ROI list (visible in the
ROI Manager window), with names of the kind: Source ROI (X,Y), where
Source ROI is the name of the original ROI (or Temp ROI if the original
ROI was not stored) and (X,Y) are the pixel coordinates.
Note: To see all ROIs as in the figure above, use Show All ROIs in the
Source Image context menu:
Original ROI |
Individual Pixel ROIs |
|
Warning: Depending on the PC used, it might be recommended to use this feature only with ROIs of moderate size, due to the potential time and memory consumption of this operation. In particular, it is not recommended to select the whole image and create individual pixel ROIs for all pixels for large images.
ROI Information
ROI Statistics
This menu item computes basic image statistics for the pixels of the displayed image contained in the ROI:
Area (pixels)
% of Image
Total Intensity
Mean Value
Standard Variation
Min Value
Max Value
The quantities are self-explanatory, except maybe for the % of Image
quantity, which is simply the area of the ROI divided by the total image area.
Export ROI Description to Notebook
While exporting a ROI description as a file is the best way to preserve
information about a ROI definition for later re-use within AlliGator, it is
also possible to export a more readable description of it to the Notebook using
the Export ROI Description to Notebook menu item.
Using a ROI Mask Image
Using ROIs defined externally is possible by providing an 8-bit ROI Mask Image
in which background pixels have a value of 0 and pixels to include in the ROI(s)
have a value of 255. Such an image needs to be loaded using the
File:Load:Other Files:Open ROI Mask menu item, as discussed in the
File Menu section of the manual:
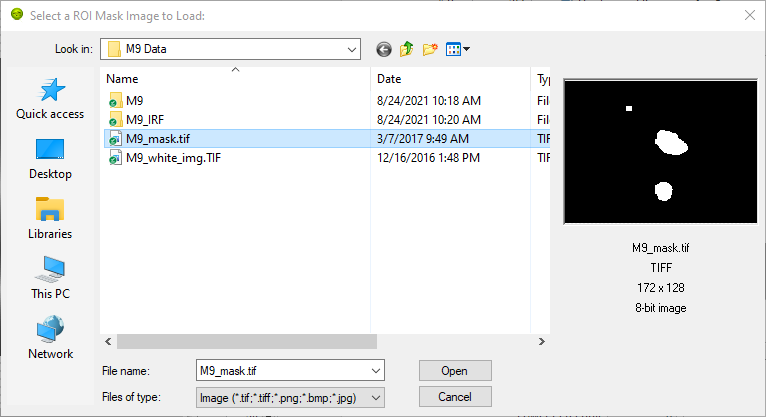
ROIs are extracted from this image using a “particle” detection algorithm which groups contiguous pixels with similar grayscale values into separate domains (or particles). In the example shown above, the mask image is comprised of two types of pixel values: 0 (black) or 255 (white). The algorithm will identify 3 groups (in the above example) and associate a ROI for each one of them. It will also “paint” each region with a different grayscale value (starting with 1 for the first particle, 2 for the second, etc.).
To invert the image before processing it, check the Invert Binary Mask
checkbox in the Source Image panel of the Settings window.
The resulting processed image will be displayed in the Source Image control using a binary color scale, which associates a very different vivid color with each consecutive pixel value.

Notice how the Displayed Image pull-down list reads ROI Mask Image. It
is possible to visualize this image at any time by selecting this value.
When loading the mask image, AlliGator will identify the different ROIs and provide them with default name constructed from the file name and the ROI order.
These names can later be modified using the ROI Manager window.
Internally, AlliGator stores one definition (the whole contour of each ROI) per
ROI, even when these ROIs are loaded from a single .roiN fle. These
definitions can be cycled through using the ROI Navigation buttons
described above or the ROI Manager window.