Fluorescence Decay Panel

The Fluorescence Decay panel can be displayed using the pull-down list at the top-right of the main AlliGator window.

In the example shown below, a point ROI was selected in the Tool Palette on the lefthand side of the Source Image, and a ROI decay analysis performed using the Analysis:Current ROI Analysis menu item (Ctrl+A). While a Single Gate image is shown in the Source Image, the analysis encompasses all gate images, whose intensities at that selected pixels are represented as a decay curve (named M9_H00_019: Plot [1]).

_images/AlliGator-Fluorescence-Decay-Panel.png

The Decay Graph is a feature-rich object which is comprised of different parts, some of which are common to all graph objects and are described in the Graph Object Anatomy page.

In particular, different types of contextual menus are accessible, depending on which area of the graph the user right-clicks:

The first and last ones are similar for all graph objects and are described in detail in the Graph Object Anatomy page.

An overview of the Decay Graph custom menu is presented below, specific functionalities being described in other pages of the manual (linked to in the section below).
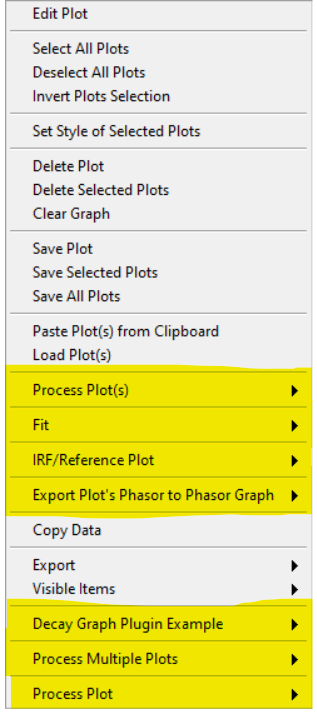
Decay Graph Custom Menu

_images/Decay-Graph-Custom-Menu.png

All items not highlighted in the image above are standard graph object contextual menu items and are described in the Graph Object Anatomy page (Custom Graph Menu section).

This section will briefly discuss the highlighted submenus, whose functions are described in specific pages.

  • Process Plot(s): this menu, shown below, allows various types of plot transformations to be performed. The last category of operations are also available as pre-processing operations applied to each decay (before plotting in the Decay Graph, or other computations involving decays such as phasor calculation) and are discussed in the Decay Preprocessing page.

_images/Decay-Graph-Custom-Menu-Process-Plot%28s%29.png

The remaining ones are:

  • Fit:

_images/Decay-Graph-Fit-Menu.png
  • IRF/Reference Plot:

_images/Decay-Graph-IRF-Reference-Decay-Menu.png
  • Export Decay to Phasor Graph:

_images/Decay-Graph-Export-Plot-Phasor.png
  • Various Python Plugins:

    Python plugins menu items and submenus will appear at the bottom of the Decay Graph menu. Their names and content will depend on each installation, but typically will contain some examples or default functionalities.

Notes